Enrique Pérez1,2
1 Space Telescope Science Institute, 3700 San Martin Drive,
Baltimore MD 21218, USA
2 Instituto de Astrofísica de Andalucía
(CSIC), Aptdo. 3004, 18080 Granada, Spain
1997, MNRAS, 290, 465.
ABSTRACT.
The understanding of temperature fluctuations in ionized nebulae is a key problem in the computation of chemical abundances, which bears on a variety of fundamental issues in Astronomy. Although the problem was stated three decades ago, its impact on the values of the abundances remains challenged, mainly because it is an ill defined one from the observational point of view. In this work we investigate the change of the ionization structure during the first 8 Myr of the evolution of a starburst. We show that large temperature fluctuations arise naturally when the spectral energy distribution of the ionizing cluster hardens during the Wolf-Rayet phase.
Key words: ISM: abundances - HII regions
- planetary nebulae - galaxies: abundances - galaxies: starburst.
1 INTRODUCTION
An accurate determination of the gas phase abundance of the elements is of fundamental importance for our understanding of the evolution of stellar systems, galaxies and the universe as a whole through constraints on the primordial helium abundance. Gas abundances are most commonly obtained from the optical spectra of planetary nebula (PN), galactic HII regions, giant extragalactic HII regions (GHIIR) and starburst galaxies. In theory, the use of intensity ratios of recombination emission lines is preferred over ratios of collisionally excited transitions for the computation of the abundances because, unlike the later which have an exponential dependence on the electronic temperature Te, recombination lines have a very shallow Te dependence. In practice, however, except in PN, the brightest metal lines in the most commonly observed optical spectra of the nebula around extragalactic star forming regions are collisionally excited ones. Thus a very accurate determination of Te becomes the key issue, because small errors in Te propagate exponentially into the abundance.
Peimbert (1967) characterizes the temperature structure of a gaseous
nebula to a second order approximation by two paramenters: the average
temperature, T0, and the root mean square temperature fluctuation, t, given
by the following expressions for an ion of abundance Ni
where Ne(r) and Ni(r) are the electron and ion density distributions and V is the volume. Two different methods to determine Te are necessary in order to resolve the two unknowns, T0 and t2, from these two equations.
Temperature fluctuations have been determined from observations of PN (Peimbert 1971; Dinerstein, Lester & Werner 1985; Liu & Danziger 1993; Liu et al. 1994; Peimbert et al. 1995ab), galactic HII regions (Rubin 1969; Liu et al. 1995; Esteban et al. 1996), and GHIIRs (González Delgado et al. 1994; Terlevich et al. 1996). The values found for t2 range up to 0.09. An excellent and comprehensive review has recently been published by Peimbert (1995).
Kingdon & Ferland (1995, hereafter KF95) have produced the most
comprehensive and systematic study that explores the hypothesis underlying
the original formulation by Peimbert, and the dependencies of t2
with different stellar and nebular parameters, such as effective temperature,
and gas density and chemical composition. They distinguish between two
different types of t2. One is the structural t2
( ![]() ) given
by the defining equation above; there is one structural t2
for each ion. The other is the observational t2 (
) given
by the defining equation above; there is one structural t2
for each ion. The other is the observational t2 ( ![]() );
this results from the necessary assumption made to compute t2
from observational data, namely that the mean temperature and fluctuations
sampled by the two different ions used to resolve the equations above are
the same. KF95 explore the validity range of these assumptions, and the
pitifalls involved in the computation of
);
this results from the necessary assumption made to compute t2
from observational data, namely that the mean temperature and fluctuations
sampled by the two different ions used to resolve the equations above are
the same. KF95 explore the validity range of these assumptions, and the
pitifalls involved in the computation of ![]() .
.
In PN and in the brightest galactic HII regions, it is possible to measure the carbon and oxygen abundance both from recombination and from collisionally excited lines. The two methods give values that can differ by a factor of 2 to 6 (see references in Peimbert 1995). This is interpreted as due to the use of an incorrect value of Te. In GHIIRs and starbursts most commonly one or at best two temperature indicators are used, and often a single value of Te is obtained from empirical relationships (e.g. Pagel et al. 1992, and references therein). The abundances computed for these objects implicitly assume very simple ionization and thermal structures of the ionized nebula. Here we will see that this is not necessarily the case in starburst regions.
The evolution of a starburst during its nebular phase, up to ~10 Myr,
implies drastic changes in the combined spectral energy distribution (SED)
of the ionizing cluster (e.g. Leitherer & Heckman 1995, hereafter LH95;
García-Vargas 1996 and references therein). In particular, a hardening
of the ionizing spectrum occurs at ~3 Myr with the appearance of the first
Wolf-Rayet stars. These changes in the SED produce complex ionization and
thermal structures, which evolve along with the ionizing cluster. We will
see below how the thermal structure can be very different across the H+
and O+2 regions, thus giving rise to important temperature fluctuations.
In section 2 we present the models and the results obtained relevant to
this work, and in section 3 we discuss the origin of the temperature fluctuations
arising from this process and their implications for the computation of
nebular abundances.
2 MODELING AND RESULTS
We use the photoionization code CLOUDY (version C90.01, Ferland 1996) to compute the ionization structure and output emission line spectrum of a starburst during the first 8 Myr, with a time step sampling of 1 Myr. The input to the code has three parts:
(a) The spectral energy distribution responsible for the ionization is taken to be the output of the stellar evolutionary synthesis models by LH95. The SEDs can be found in electronic form in the CD-ROM from Leitherer et al. (1996). From the models computed by LH95, we use those of an instantaneous burst with a Salpeter initial mass function, and mass upper limit of 100 Msol. The lower limit mass cutoff is 1 Msol and the total mass of the burst 106 Msol. The models are based on the Geneva evolutionary tracks and NLTE atmospheres for the WR stars.
(b) We compute photoionization models for two different metallicity ranges, solar and one tenth of solar. For the later, the gas chemical composition is simply scaled down by an order of magnitud from the solar value, except the helium abundance which is left unchanged. The SED from LH95 appropriate to each of the two metallicity ranges is used, so the gas and stars have approximately the same metallicity.
(c) The gas is distributed in a spherical geometry around the ionizing cluster, with an inner radius of 3.24 pc (a typical value for the core radius of super star clusters, O'Connell, Gallagher & Hunter 1994; Meurer et al. 1995; Watson et al. 1996), and an outer radius given by the ionization equilibrium; the code is stoped when a low equilibrium temperature is reached, so that the all models presented here are ionization bounded. For solar metallicity, we explore three different values of the filling factor, log ff= 0, -1, and -3. The models with a tenth of solar metallicity are computed only for log ff= -1. The gas particle density is uniform and the same for all the models at a value 100 cm-3.
Table 1 presents the values of the mean temperature weighted in different
ways and the square temperature fluctuations, t2. Two sets of
t2 values are given in the output: (a) the structural ![]() for the O+2 (
for the O+2 ( ![]() )
and for the H+ (
)
and for the H+ (![]() )
zones, and (b) the observational
)
zones, and (b) the observational ![]() obtained from two common temperature indicators (T[OIII]
from the [OIII] 4363/5007 ratio and TBac from the
Balmer jump Bac/Hb). Column 1 gives the metallicity,
columns 2 and 3 the filling factor in log scale and the age, columns 4
and 5 the temperatures T[OIII] and TBac, columns 6
and 7 give the density weighted mean electron temperature in the O+2
and the H+ zones, columns 9 and 10 list the structural
obtained from two common temperature indicators (T[OIII]
from the [OIII] 4363/5007 ratio and TBac from the
Balmer jump Bac/Hb). Column 1 gives the metallicity,
columns 2 and 3 the filling factor in log scale and the age, columns 4
and 5 the temperatures T[OIII] and TBac, columns 6
and 7 give the density weighted mean electron temperature in the O+2
and the H+ zones, columns 9 and 10 list the structural ![]() and
and ![]() , and
columns 8 and 11 give the average electron temperature T0 and square fluctuations
, and
columns 8 and 11 give the average electron temperature T0 and square fluctuations ![]() obtained with the same methodology used from the observations as originally
proposed by Peimbert (1967). For reference, column 12 gives the flux of
HeII 4686 relative to Hb
for ages above 3 Myr when the fluctuations are larger; the published values
for this line ratio for WR galaxies range between 0.01 and 0.05 (Masegosa,
Moles & del Olmo 1991; Pagel et al. 1992; Izotov, Thuan & Lipovetsky
1996).
obtained with the same methodology used from the observations as originally
proposed by Peimbert (1967). For reference, column 12 gives the flux of
HeII 4686 relative to Hb
for ages above 3 Myr when the fluctuations are larger; the published values
for this line ratio for WR galaxies range between 0.01 and 0.05 (Masegosa,
Moles & del Olmo 1991; Pagel et al. 1992; Izotov, Thuan & Lipovetsky
1996).
Table 1. Grid of model output temperatures and square temperature fluctuations. The intensity of HeII 4686 relative to Hb is included as a reference.
At solar abundance, the line temperature diagnostics T[OIII]
> TBac, but the opposite is true for the structural temperatures T(O+2)
<= T(H+). This is easily understood. In the first case the
value of the temperature is weighted upwards because [OIII]4363
is produced in hotter regions, while the Coulomb interaction during the
recombination process which produces the Balmer emission is more efficient
for low kinetic energy electrons. In the second case, while T(O+2)
only samples part of the ionized nebula, T(H+) samples all of
it, in particular the inner very hot zone where the oxygen is ionized into
O+3 and higher, or, in low ionization cases, the outer O+
zone that is often (though not always) hotter than the O+2 zone.
From Table 1, ![]() is larger than
is larger than ![]() on average by a factor of 3, while
on average by a factor of 3, while ![]() when
the fluctuations are significant (
when
the fluctuations are significant ( ![]() ).
Figure 1 shows the dependence of
).
Figure 1 shows the dependence of ![]() with the age of the burst for the solar metallicity models; the value of
logf is indicated. Note how in general temperature
fluctuations are fairly large. The values of
with the age of the burst for the solar metallicity models; the value of
logf is indicated. Note how in general temperature
fluctuations are fairly large. The values of ![]() are very large for filling factors larger than 0.001, they are in fact
above the 5% mark for burst ages of 3 to 7 Myr.
are very large for filling factors larger than 0.001, they are in fact
above the 5% mark for burst ages of 3 to 7 Myr.

Figure 1. Dependence ofwith the age of the burst and with the filling factor of the gas. The model results shown are for solar metallicity.
3 DISCUSSION
Peimbert (1995) summarizes the range of values found for t2 from observations, 0.01<=t2<=0.09, and from models, 0.00<=t2<=0.02, of homogeneous nebula (both in density and abundance). Because of this difference between the computed and the observed values of t2, it has been argued that the origin of the fluctuations could be in the density distribution of the ionized gas and/or in chemical inhomogeneities. The former has been explored by KF95, who conclude that an inhomogeneous density distribution would have little effect on the derived value of t2, as long as the densities are kept below the critical density; for densities high enough to produce the collisional de-excitation of [OIII] 5007 but not of [OIII] 4363, Viegas & Clegg (1994) find that high density condensations can produce moderate temperature fluctuations. Preliminary calculations suggest that chemical inhomogeneities are also probably insufficient to resolve the observed discrepancies (Kingdon 1996, private communication). A third process that has been invoqued as a possible origin for temperature fluctuations is the presence of shocks as important sources of line emission (Peimbert 1995); and indeed, an increasing body of observations points to the ubiquitous presence of shocks in PN and in HII regions.
However, the results presented in section 2 show that there is yet an additional cause for temperature fluctuations, which is very important even in the absence of density or chemical inhomogeneities or shock ionized regions. This process must be operating at least in starburst regions, and possibly in some GHIIRs and PN with central WR stars. The explanation of the large t2 values obtained becomes clear when we look at the temperature structure of the nebula. Figure 2 shows the radial dependence of Te as a function of the age of the burst, from 2 Myr to 7 Myr, for the solar metallicity case with filling factor 0.1. Up to 2 Myr the ionization and thermal balance in the nebula is given by the radiation field produced by the OB stars, but when the Wolf-Rayet stars appear, approximately at 3 Myr, the spectral energy distribution changes very significantly, becoming extremely hard. This produces a secondary hot thermal structure in the inner part of the nebula where the oxygen is highly ionized, in the form of O+3 and higher ionization stages. Thus, in effect, the O+2 region decreases in relation to the H+ region which, in turn, becomes hotter on average due to the new hot highly ionized zone.
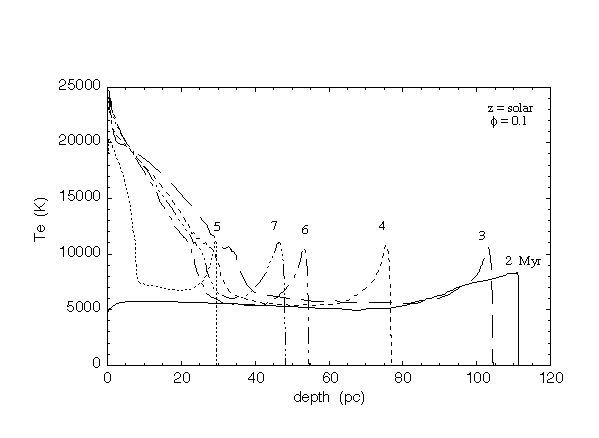
Figure 2. Temperature structure of the model nebula as a function of depth into the nebula and of the burst age. The model results shown are for solar metallicity and a filling factor of 0.1.
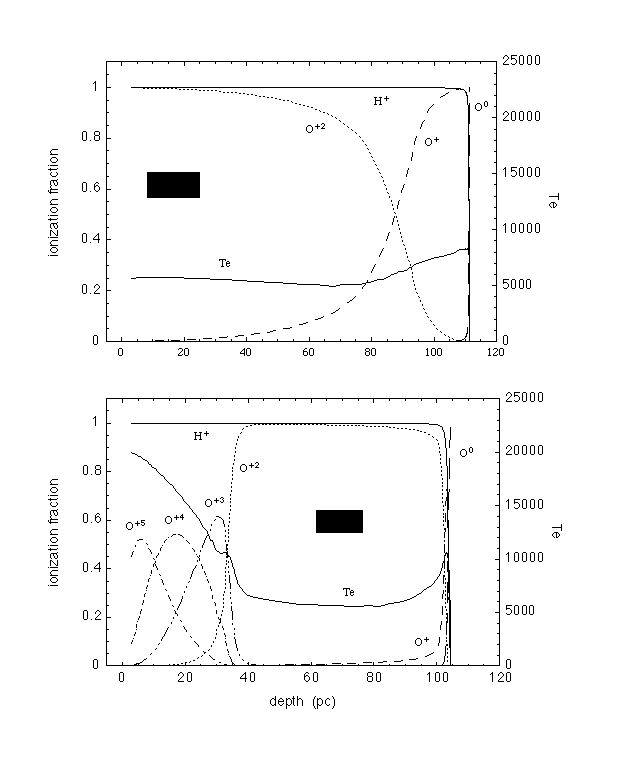
Figure 3. Hydrogen and oxygen ionization structures at two epochs, 2 Myr and 3 Myr. The temperature structure is also plotted for reference. The model results shown are for solar metallicity and a filling factor of 0.1. The temperature structure is relatively flat at 2 Myr, when the ionization and thermal balance is produced by OB stars, however, the onset of the WR phase at 3 Myr produces an inner hot region, where the O+2 is ionized into higher stages.
Figure 3 illustrates this more clearly. It shows the hydrogen and oxygen ionization (thin lines) and the temperature (thick line) structures at 2 Myr (upper panel) and at 3 Myr (lower panel). At 2 Myr, the structure is that of a typical nebula ionized by OB stars, with an inner large O+2 zone and an outer smaller O+ zone; the outer zone is somewhat hotter because the ionization there is produced by the higher energy photons that see lower absorption cross-section and thus a longer mean free path. The mean temperature does not change much, staying relatively low between 6000 K and 8000 K; thus both the H+ and the O+2 are sampling much the same temperature, and t2 is small.
A dramatic change occurs at 3 Myr. The WR now contribute significantly
to change the shape of the SED, particularly above ~40 eV (Fig. 4). The
third and fourth ionization potentials of oxygen are 54.9 eV and 77.4 eV,
thus all the O+2 in the inner zone is ionized into O+3
and higher stages. This inner zone is now very hot because the high energy
photons absorbed here also produce electrons with high residual kinetic
energy and the local thermal equilibrium is achieved at high temperatures.
The O+2 lines [OIII] 4363, 5007 Å
used for the computation of the electron temperature (column four T[OIII]
in Table 1) are produced mainly in the hotter regions of the O+2
zone (at 3 Myr these are between 20 pc and 40 pc and between 90 pc and
105 pc); the Balmer emission is produced mainly in the cooler region between
40 pc and 100 pc. However, because the H+ zone samples a wider
range in temperature values, the structural value of ![]() is larger than that of
is larger than that of ![]() .
In any case, the temperature structure at 3 Myr is so much more varied
than at earlier epochs, and the temperature fluctuations are consequently
larger. A similar explanation is put forward by KF95 to explain the increasing
trend of t2 with the effective temperature of the ionizing source.
.
In any case, the temperature structure at 3 Myr is so much more varied
than at earlier epochs, and the temperature fluctuations are consequently
larger. A similar explanation is put forward by KF95 to explain the increasing
trend of t2 with the effective temperature of the ionizing source.
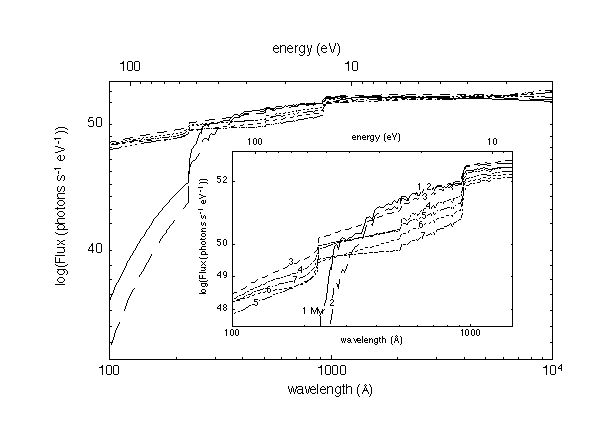
The subsequent evolution of t2 with the age of the burst, given by the evolution of the ionization structure, is governed by the relative behaviour of the SED between 13.6 eV and ~30 eV on one side, and above ~30 eV on the other side. The former spectral range follows a steady decline produced by the aging of the burst, while the SED at higher energies is controlled by the ups and downs of the WR stars.Figure 4. Spectral energy distribution of the ionizing cluster as a function of wavelength and energy for ages 1 Myr to 7 Myr. Note the dramatic changes at 3 Myr, when the SED hardens significantly.
The effect of lowering the filling factor is to make the ionization zones less sharply defined and decrease the general level of ionization. For lower filling factors the ionized region becomes significantly larger, and when the SED hardens the secondary hot inner zone is much less conspicuous in size, and thus the value of t2 is reduced with respect to that of a higher filling factor region.
The cause of the lack of fluctuations by decreasing the metallicity is different. Basically, for the low metallicity value that we explore here, one tenth of solar, the major effect is produced by the low numbers of WR stars at this metallicity, and thus, because the increased t2 with the burst evolution at solar metallicity is produced by the hardening of the SED contributed by the WR stars, this does not happens at this low values of the metallicity. However, although less WR stars are produced are at low metallicity, the actual numbers predicted by he theory of stellar evolution are quite uncertain. In fact, although the LH95 models do not produce a significant number of WR stars at a tenth of solar metallicity, a prominent spectral feature at 4600 Å is present in some galaxies at lower metallicities, possibly indicating the presence of large numbers of WR stars (González Delgado et al. 1994; Izotov, Thuan & Lipovetsky 1996).
Esteban & Peimbert (1995) have suggested that the outlier location
of the WR galaxies in the helium versus metallicity diagram, used by Pagel
et al. (1992) for the determination of the primordial helium abundance,
could be due to a higher value of t2 in these galaxies than
in GHIIRs without WR features; they further indicate
that shocks could be the origin of these fluctuations. We have shown here
that, even without the need of a key rôle for shocks, the suggestion
of Esteban & Peimbert is indeed an excellent one, because as t2
increases so much with the onset of the WR stars in a starburst, it is
expected that galaxies where the WR features are so prominent will have
indeed a very large value of t2.
ACKNOWLEDGMENTS
I am grateful to Gary Ferland for making CLOUDY easily available,
to Claus Leitherer for providing early access to an electronic version
of the SED, and to Rosa M. González Delgado for teaching me how
to use them both. I have benefited from discussions with and comments from
Rosa M. González Delgado, Jim Kingdon, Angeles Díaz, Claus
Leitherer, Manuel Peimbert, and Daniel Schaerer. This work is financed
by DGICyT grants PB93-0139 and PR95-329. I thank the Director of the Space
Telescope Science Institute for the occasion to visit the Institute during
the course of this research. The Space Telescope Science Institute is operated
by AURA, Inc., under NASA contract NAS5-26555.
REFERENCES
Dinerstein, H.L., Lester, D.F., Werner, M.W., 1985, ApJ, 291, 561
Esteban, C., Peimbert, M., 1995, A&A, 300, 78
Esteban, C., et al., 1996, in preparation
Ferland, G.J., 1996, HAZY a brief introduction to CLOUDY, University of Kentucky internal report.
García-Vargas, M.L., 1996, in From Stars to Galaxies: The Impact of Stellar Physics on Galaxy Evolution, Astronomical Society ofthe Pacific Conference Series, vol. 98, editors C. Leitherer, U. Fritze-von Alvensleben & J. Huchra, (San Francisco), p. 244
González Delgado, R.M., Pérez, E., Tenorio-Tagle, G., et al., 1994, ApJ, 437, 239
Izotov, Y.I., Thuan, T.X., Lipovetsky, V.A., 1996, ApJ, in press
Kingdon, J., Ferland, G.J., 1995, ApJ, 450, 691 (KF95)
Leitherer, C., Heckman, T.M., 1995, ApJS, 96, 9 (LH95)
Leitherer, C., et al., 1996, PASP, in press
Liu, X.W., Danziger, J., 1993, MNRAS, 263, 256
Liu, X.W., Storey, P.J., Barlow, M.J., Clegg, R.E.S., 1994, MNRAS, 272, 369
Liu , X.-W., Barlow, M.J., Danziger, I.J., Storey, P.J., 1995, ApJ, 450, L59
Masegosa, J., Moles, M., del Olmo, A., 1991, A&A, 244, 273
Meurer, G.R., Heckman, T.M., Leitherer, C., Kinney, A., Robert, C., Garnett, D.R., 1995, AJ, 110, 2665
O'Connell, R.W., Gallagher, J.S., Hunter, D.A., 1994, ApJ, 433, 65
Pagel, B.E.J., Simonson, E.A., Terlevich, R.J., Edmunds, M.G., 1992, MNRAS, 255, 325
Peimbert, M., 1967, ApJ, 150, 825
Peimbert, M., 1971, Bol. Obs. Tonantzintla y Tacubaya, 6, 29
Peimbert, M., 1995, in The Analysis of Emission Lines, Proceedings of the Space Telescope Science Institute Symposium number 8, editors R. Williams & M. Livio, (Cambridge CUP), p. 165
Peimbert, M., et al., 1995a, RMexAA, 31, 131
Peimbert, M., et al., 1995b, RMexAA, 31, 147
Rubin, R.H., 1969, ApJ, 155, 841
Terlevich, E., Díaz, A.I., Terlevich, R.J., González Delgado, R.M., Pérez, E., García-Vargas, M.L., 1996, MNRAS, 280, 1219
Watson, A.M., et al., 1996, AJ, 112, 534