|
RETRIEVAL OF MIDDLE ATMOSPHERE CO IN POLAR REGIONS
Retrieval of CO abundance in the stratosphere and mesosphere from the
non-LTE radiances measured by the Improved Stratospheric and Mesospheric
Sounder (ISAMS) on UARS . This is the first time that retrievals from
IR emissions presenting variability from LTE to non-LTE regions are
performed operationally to obtain full profile abundances. The results
represent the first global measurements of this important dynamics tracer
in the mesosphere and in polar regions.
Results of the validation and some scientific studies carried out with these data
can be found in the publications:
Global and seasonal variations in middle atmosphere CO from UARS/ISAMS
Lopez-Valverde et al., Geophys. Res. Lett., 20, 1247-1250, 1993
Abstract [ ASCII text file ]
Validation of measurements of carbon monoxide from the Improved
Stratospheric and Mesospheric Sounder
Lopez-Valverde et al., J. Geophys. Res. 101, 9929-9955, 1996
Postscript File [ GNUzipped Tar files , 297 Kb ]
Observations of Midel Atmosphere CO from the UARS ISAMS During the Early
Northern Winter 1991/1992
Allen et al., J. Atmos. Sci., 56, pp.563-583, 1999
Postscript File [ GNUzipped Tar files , 5.9 Mb!! ]
A selection of results from these works follow.
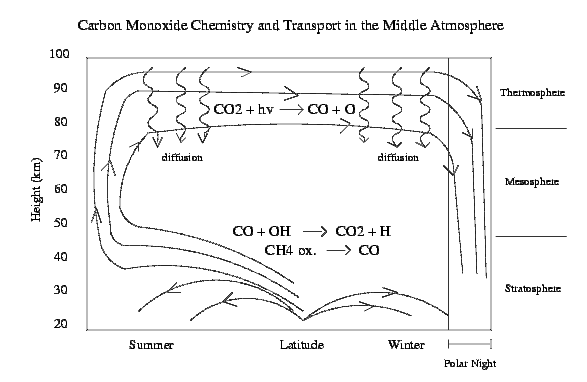 Figure 1 of Allen et al., JAS, 56, pp.563-583, 1999, adapted from
the pioneering work by Solomon et al., JAS, 42, pp.1072-1083, 1985, on
photochemistry and transport of Co in the middle atmosphere.
This is a schematic of the chemical and transport processes that dominate
the latitudinal distribution of CO in the middle atmosphere. Notice the
downwelling transport of air in the polar night region. Air rich in CO
from mid-latitudes will descent and CO is accumulated at high latitudes.
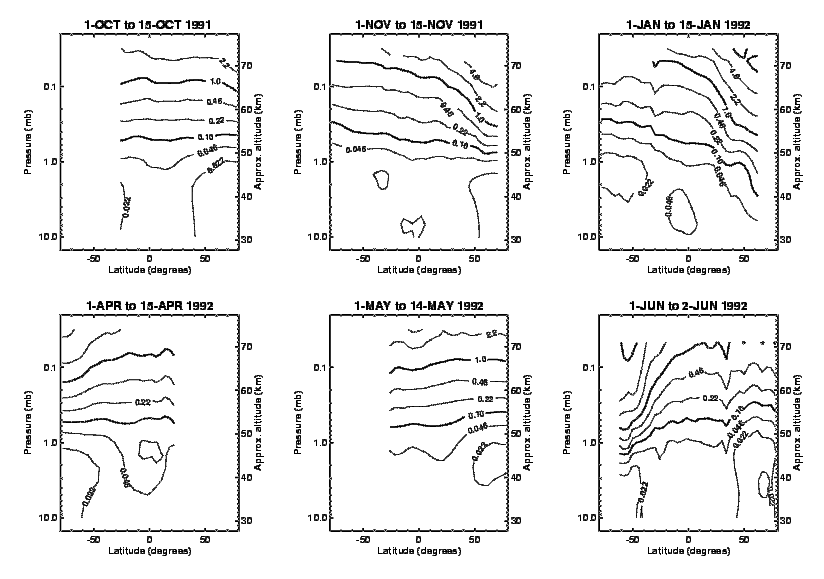 Figure 10 of Lopez-Valverde et al., JGR, 101, pp.9929-9955, 1996.
It is a sequence of zonal mean cross sections of CO volume mixing ratio
(in parts per million by volume, with 3 contours per decade) throughout
the mission. The data are averages of ISAMS daytime data. See the paper for
more details. The figure shows nicely, for the first time with a single
instrument, the seasonal and latitudinal distribution of CO. Particularly
interesting is to see how this atmospheric gas traces very clearly the
reversal of the meridional circulation during equinoxes.
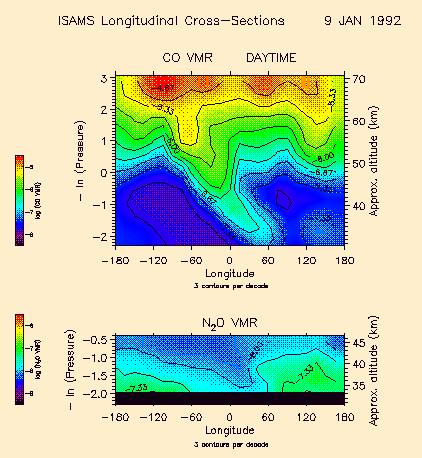 This is a coloured version of Figure 11 in
Lopez-Valverde et al., J. Geophys. Res. 101, 9929-9955, 1996.
Now these are longitude-height cross sections of CO and N2O volume mixing
ratios at 64 degree North measured by ISAMS on Jan 9th, 1992.
The figure shows beautifully how a mass of mesospheric air rich in CO
descends into the stratosphere at polar regions. Actually the area of
rich CO air extends to lower latitudes, as low as 44 N. Parallel analysis
of the temperature field by Reburn et al., GRL, 20, pp.1231-1234, 1993
indicates that this area corresponds to the polar vortex, which was highly
displaced from the North Pole that day. Similar tongues of descending air
have been simulated by GCMs (see the N2O simulations by Nielsen et al,
JGR, 99, pp.5399-5420, 1994). This suggest that CO can be an excellent
tracer of polar dynamics even at stratospheric altitudes where, in the
abscence of OH during the polar night, its chemical lifetime is quite long.
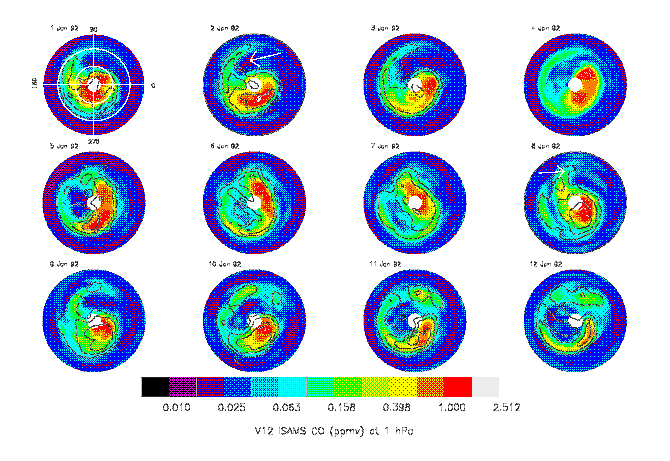 Figure 8 from Allen et al., JAS, 56, pp.563-583, 1999
These are projections of CO ISAMS data at 1 mb (around the stratopause)
in the polar winter during the first days of January 1992, together with
PV contours. See the paper for more datails.
This is another beautiful view of how the CO data traces the evolution
of the polar vortex. The polar vortex, initially centered over the pole,
quickly developes a tail that elongates until joining the main cell 4 days
later. The shape of the vortex can be very comma-like and displaced from
the pole. Allen et al. show other interesting results and numerical
simulations.
|



 Figure 1 of Allen et al., JAS, 56, pp.563-583, 1999, adapted from
the pioneering work by Solomon et al., JAS, 42, pp.1072-1083, 1985, on
photochemistry and transport of Co in the middle atmosphere.
This is a schematic of the chemical and transport processes that dominate
the latitudinal distribution of CO in the middle atmosphere. Notice the
downwelling transport of air in the polar night region. Air rich in CO
from mid-latitudes will descent and CO is accumulated at high latitudes.
 Figure 10 of Lopez-Valverde et al., JGR, 101, pp.9929-9955, 1996.
It is a sequence of zonal mean cross sections of CO volume mixing ratio
(in parts per million by volume, with 3 contours per decade) throughout
the mission. The data are averages of ISAMS daytime data. See the paper for
more details. The figure shows nicely, for the first time with a single
instrument, the seasonal and latitudinal distribution of CO. Particularly
interesting is to see how this atmospheric gas traces very clearly the
reversal of the meridional circulation during equinoxes.
 This is a coloured version of Figure 11 in
Lopez-Valverde et al., J. Geophys. Res. 101, 9929-9955, 1996.
Now these are longitude-height cross sections of CO and N2O volume mixing
ratios at 64 degree North measured by ISAMS on Jan 9th, 1992.
The figure shows beautifully how a mass of mesospheric air rich in CO
descends into the stratosphere at polar regions. Actually the area of
rich CO air extends to lower latitudes, as low as 44 N. Parallel analysis
of the temperature field by Reburn et al., GRL, 20, pp.1231-1234, 1993
indicates that this area corresponds to the polar vortex, which was highly
displaced from the North Pole that day. Similar tongues of descending air
have been simulated by GCMs (see the N2O simulations by Nielsen et al,
JGR, 99, pp.5399-5420, 1994). This suggest that CO can be an excellent
tracer of polar dynamics even at stratospheric altitudes where, in the
abscence of OH during the polar night, its chemical lifetime is quite long.
 Figure 8 from Allen et al., JAS, 56, pp.563-583, 1999
These are projections of CO ISAMS data at 1 mb (around the stratopause)
in the polar winter during the first days of January 1992, together with
PV contours. See the paper for more datails.
This is another beautiful view of how the CO data traces the evolution
of the polar vortex. The polar vortex, initially centered over the pole,
quickly developes a tail that elongates until joining the main cell 4 days
later. The shape of the vortex can be very comma-like and displaced from
the pole. Allen et al. show other interesting results and numerical
simulations.