|
OH EMISSION IN THE MESOSPHERE OBSERVED BY ISAMS
The work and results described here correspond to the work


The Detection of the Hydroxyl Nightglow Layer in the Mesosphere by
ISAMS/UARS
Zaragoza, G., M. Lopez-Puertas, M. A. Lopez-Valverde and F. W. Taylor
Geophys. Res. Lett, 25, pp.2417-2420, 1998.
Postscript File [ GNUzipped Tar files , 226 Kb ]


The infrared radiometer ISAMS flown on bard UARS for almost a year.
One of its channels, at 4.6 um, was devoted to the determination
of carbon monoxide in the middle atmosphere.
The signal used for the retrieval of CO is the "pressure modulated" signal,
but the channel also supplies a wideband signal of about 200 cm-1 width,
with half-power points at 2170 and 2260 cm-1. This signal has been used
to extract information about the abundance of CO2 in the mesosphere.

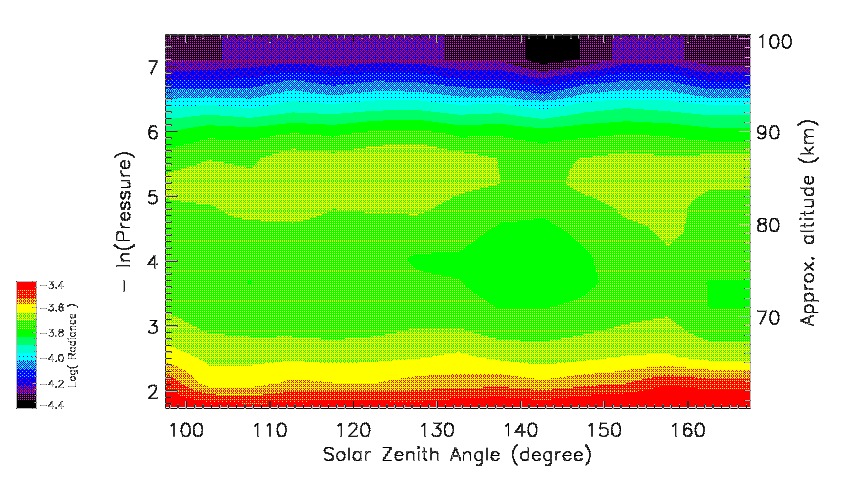
These wideband measurements show a clear enhancement in the upper mesosphere.
The limb radiances at 4.6 um not only do not decrease with increasing
tangent altitude but presetn a small maximum around 85 km. This is shwon
in the following figure, taken from the above mentioned work,


  Figure 1.
Variation of the ISAMS 00W nightime radiance with altitude and SZA.
Data correspond to averages. See paper for more details.


where the variation of the Channel 0 Wideband signal with solar zenith angle
is shown. SZA is linked to latitude in the ISAMS observational geometry,
and for this particular day the range shown corresponds to latitudes from
35 S to 70 N.

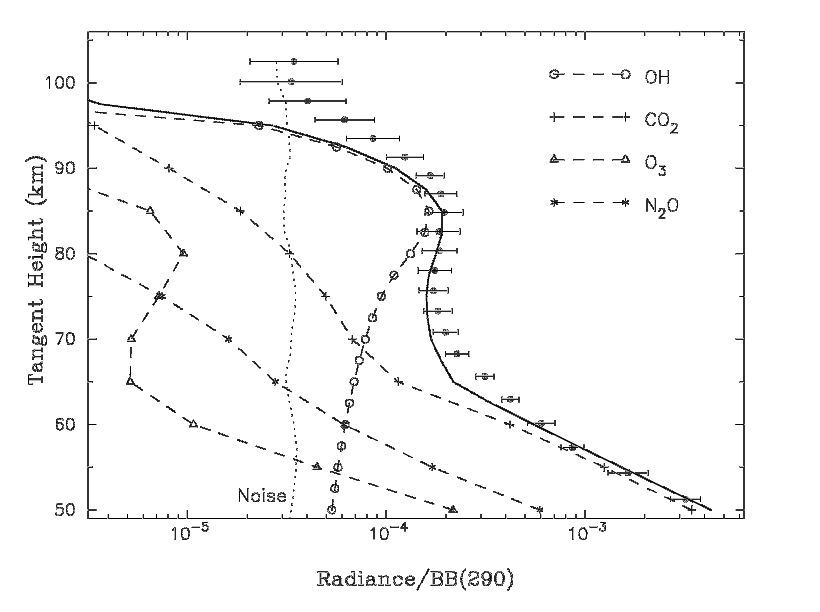
Using the atmospheric gases with known IR emissions in this spectral range,
abundances of OH(8,9) populations from a photochemical model, and recent
values of the Einstein spontaneous emission coefficients, we were able to
determine that they are the OH emissions in the bands OH(9-8) and OH(8-7)
the major responsible for the local maximum detected. The simulation is
shown in the following figure, also from the mentioned paper.


  Figure 2.
Measured and calculated ISAMS 00W nighttime zonal mean radiance profiles
for October 6, 1991, at 15 S. Black dots: measurements with standard
deviation. Solid: calculated total radiance. Dashed: contributions.
|


